Data-Generated Illustrations
Data-Generated Illustrations
This collection of data visualizations is an early take on Matplotlib, Plotly and Dash. Please note that there is a follow-up project in my portfolio, the Interactive Dashboard.
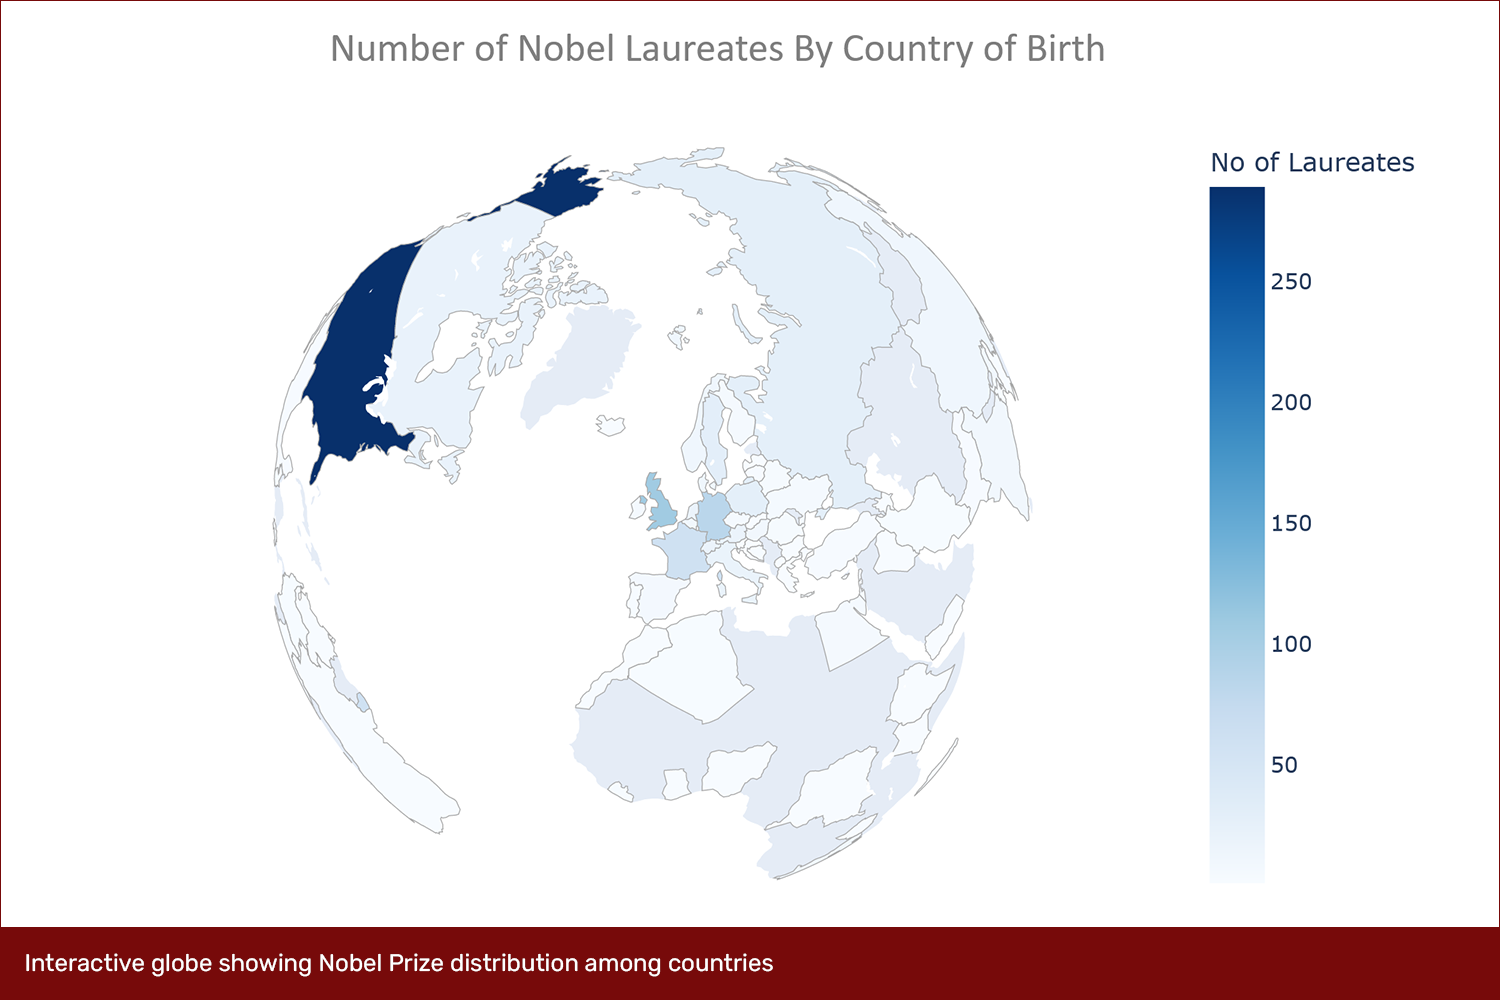
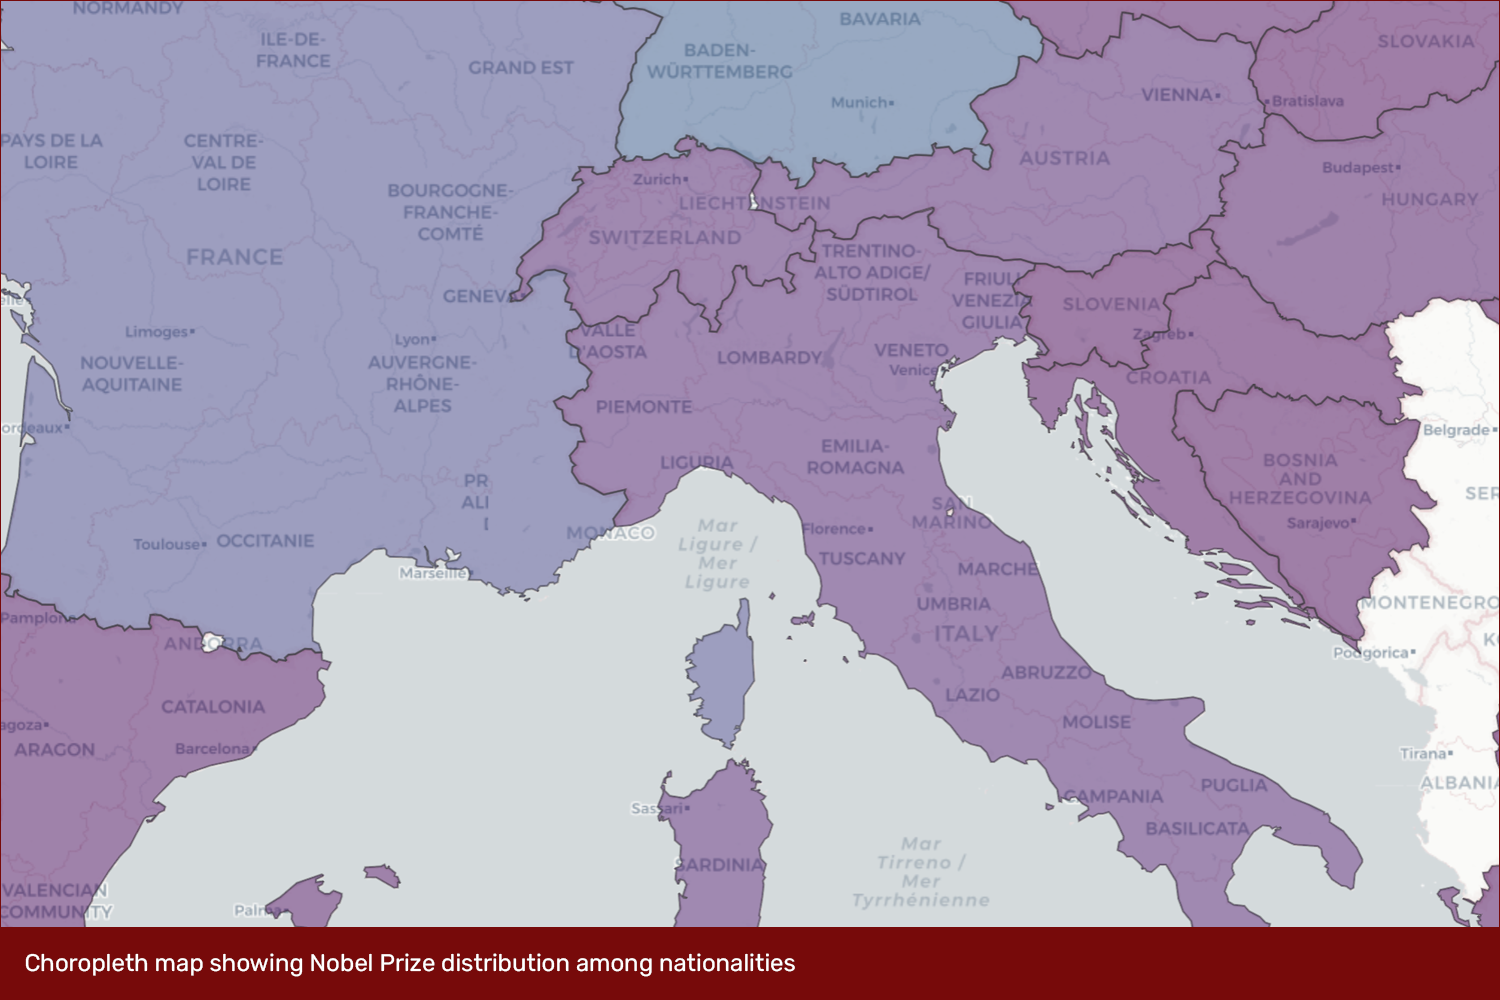
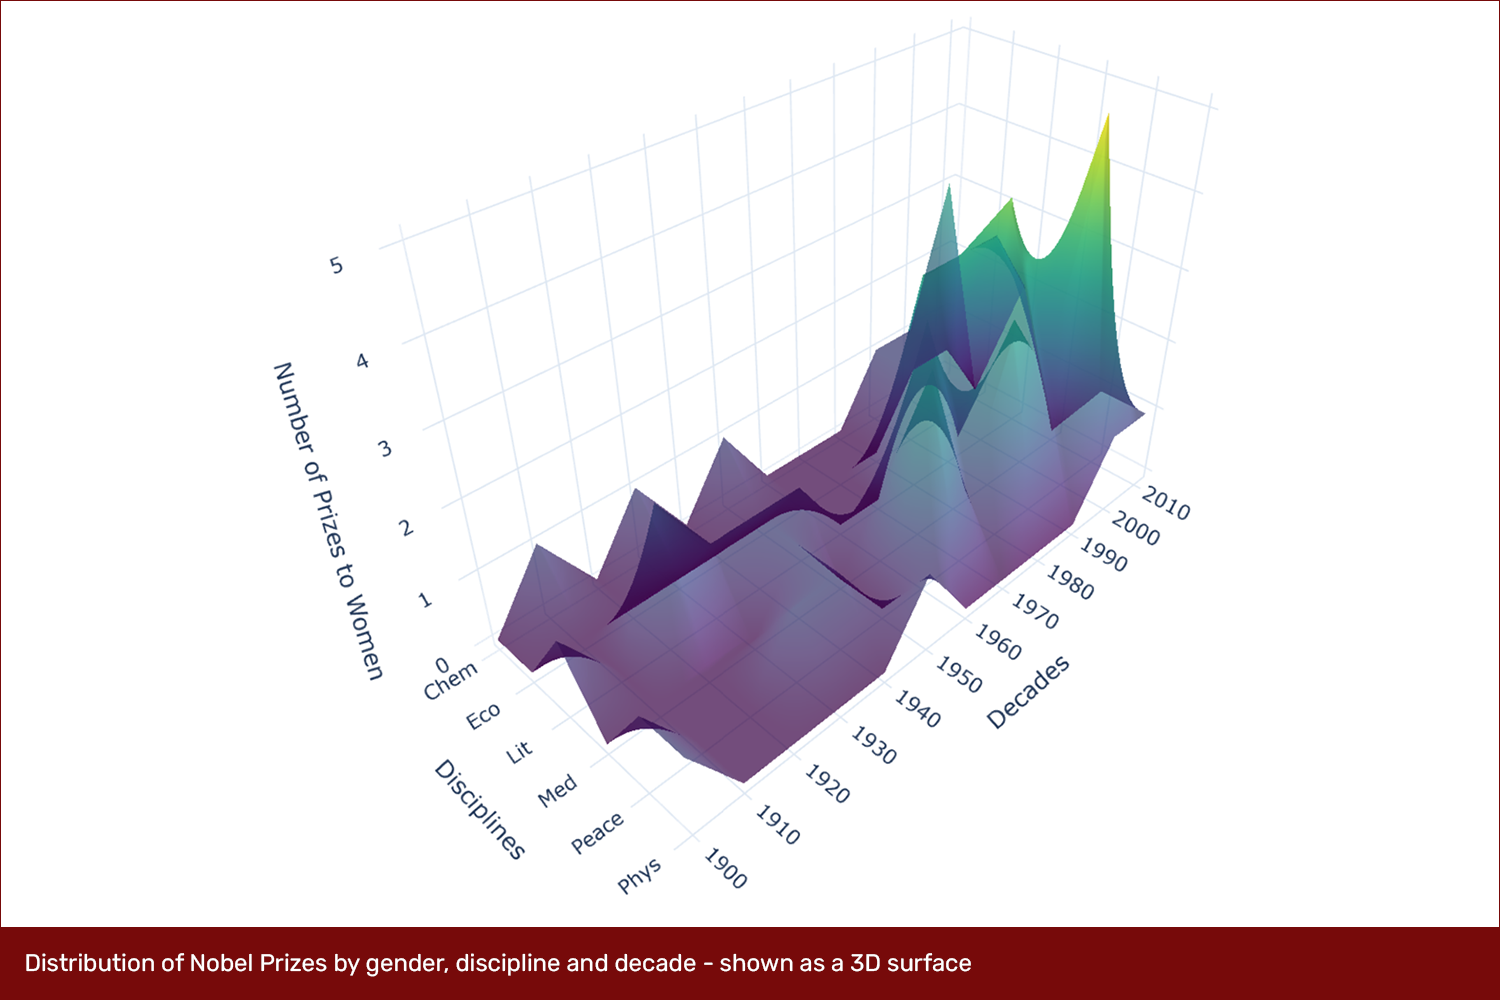
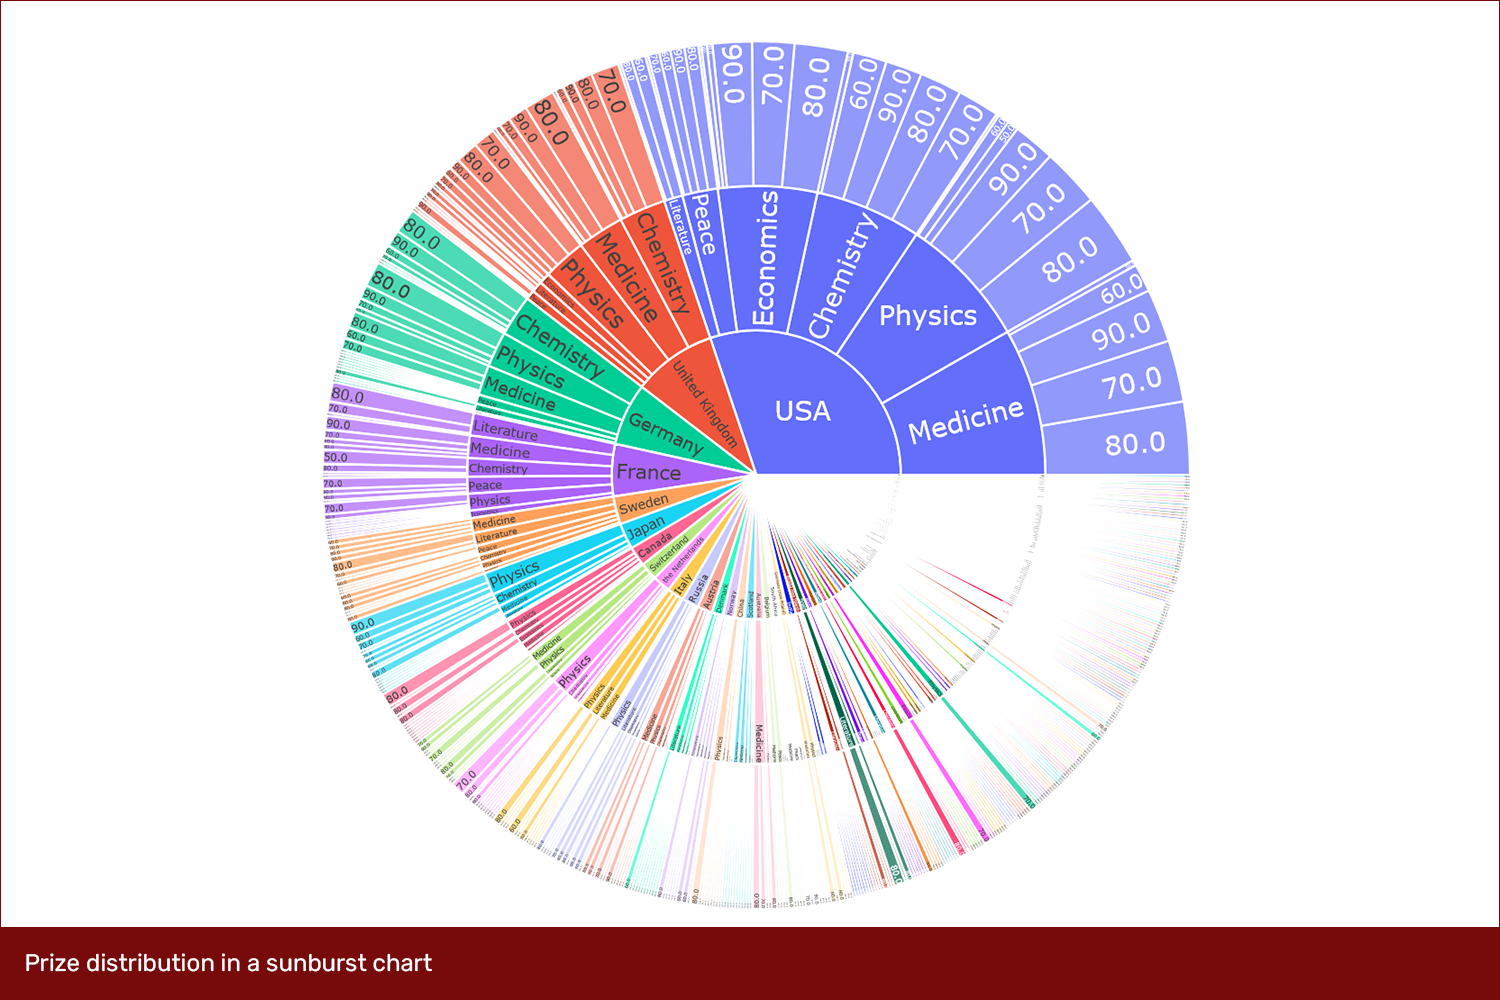
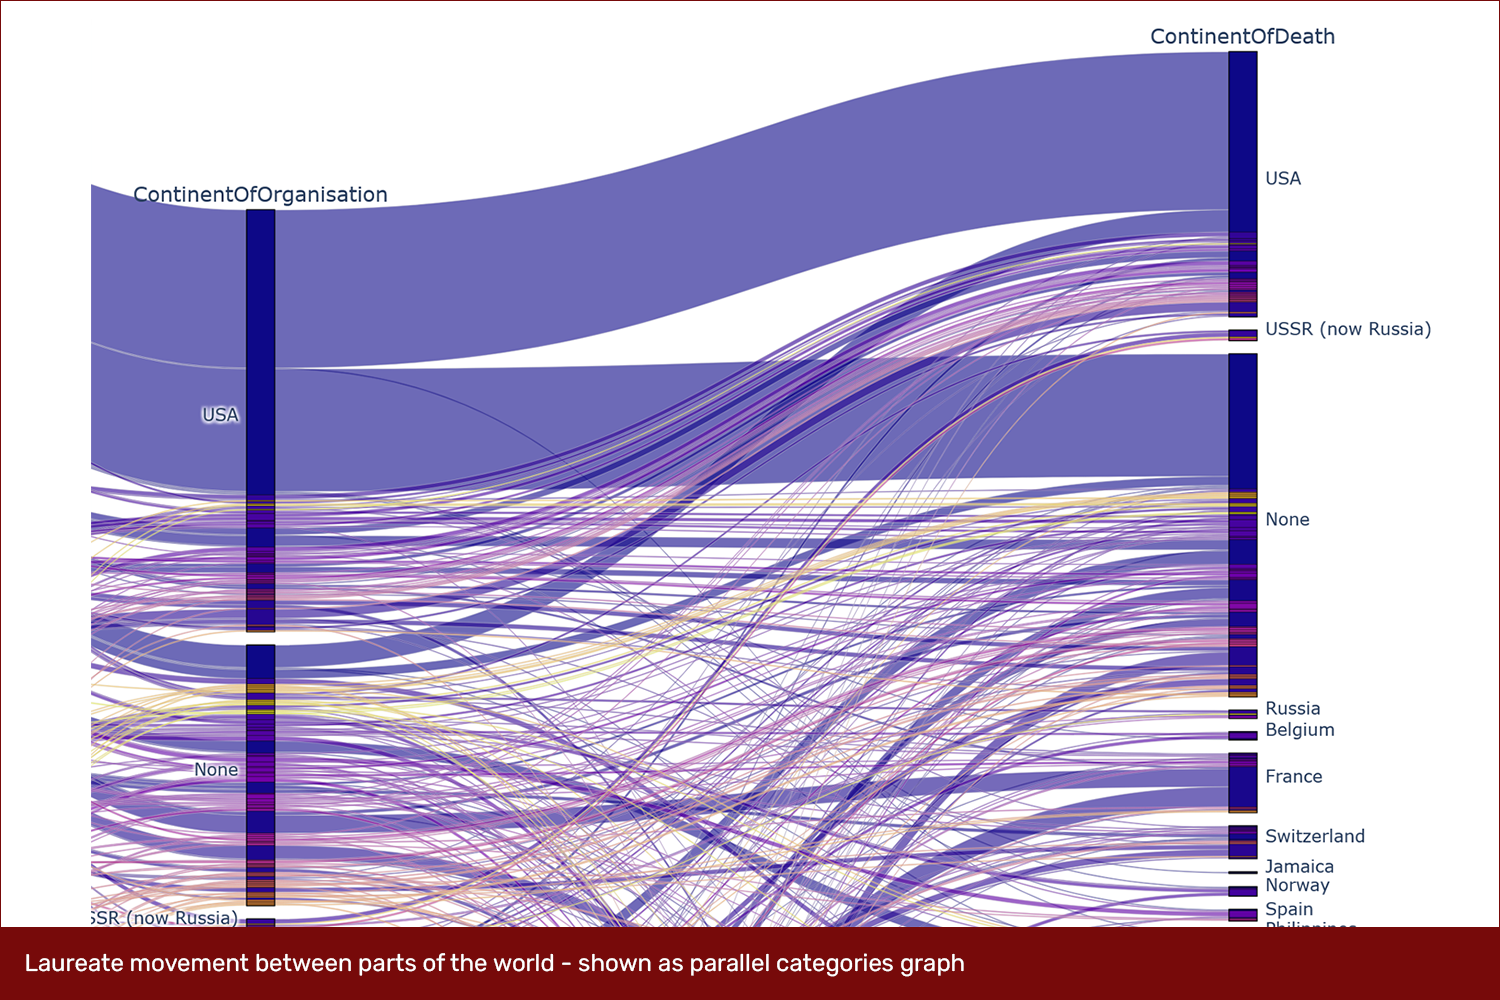
The results of this set is available as Jupyter Notebook on Kaggle as well as on my Github page. It explores various aspects of the Nobel Prizes in advanced data visualizations.
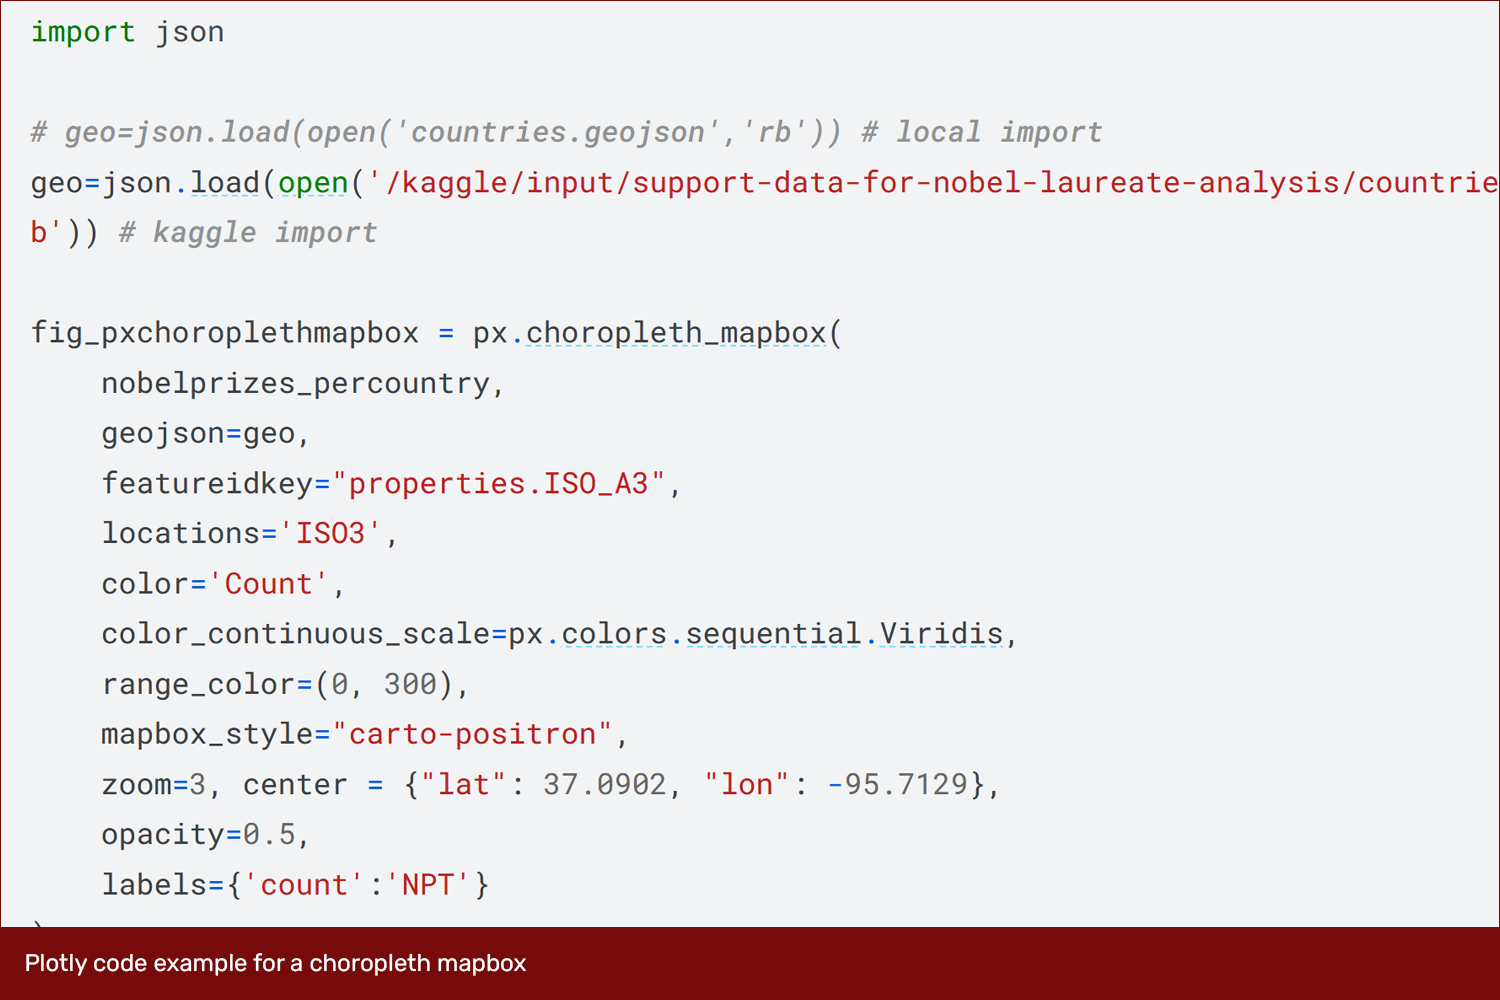
The notebook was set up in a way such that it can be easily used by others as a tutorial to learn more about Pandas, Plotly and the Nobel Prize.
Task
Create interactive graphics using Plotly and Pandas
-
Date
Dezember 31, 2023
-
Skills
Python, Plotly, Plotly Express
-
Client
Portfolio Project