Interactive Dashboard
Interactive Dashboard
This interactive dashboard is the follow-up to the Plotly visualizations (portfolio).
It utilizes Plotly, Dash, Dash Mantine Components, and Flask.
The project also included setting up a VPS Linux webserver and keeping it running.
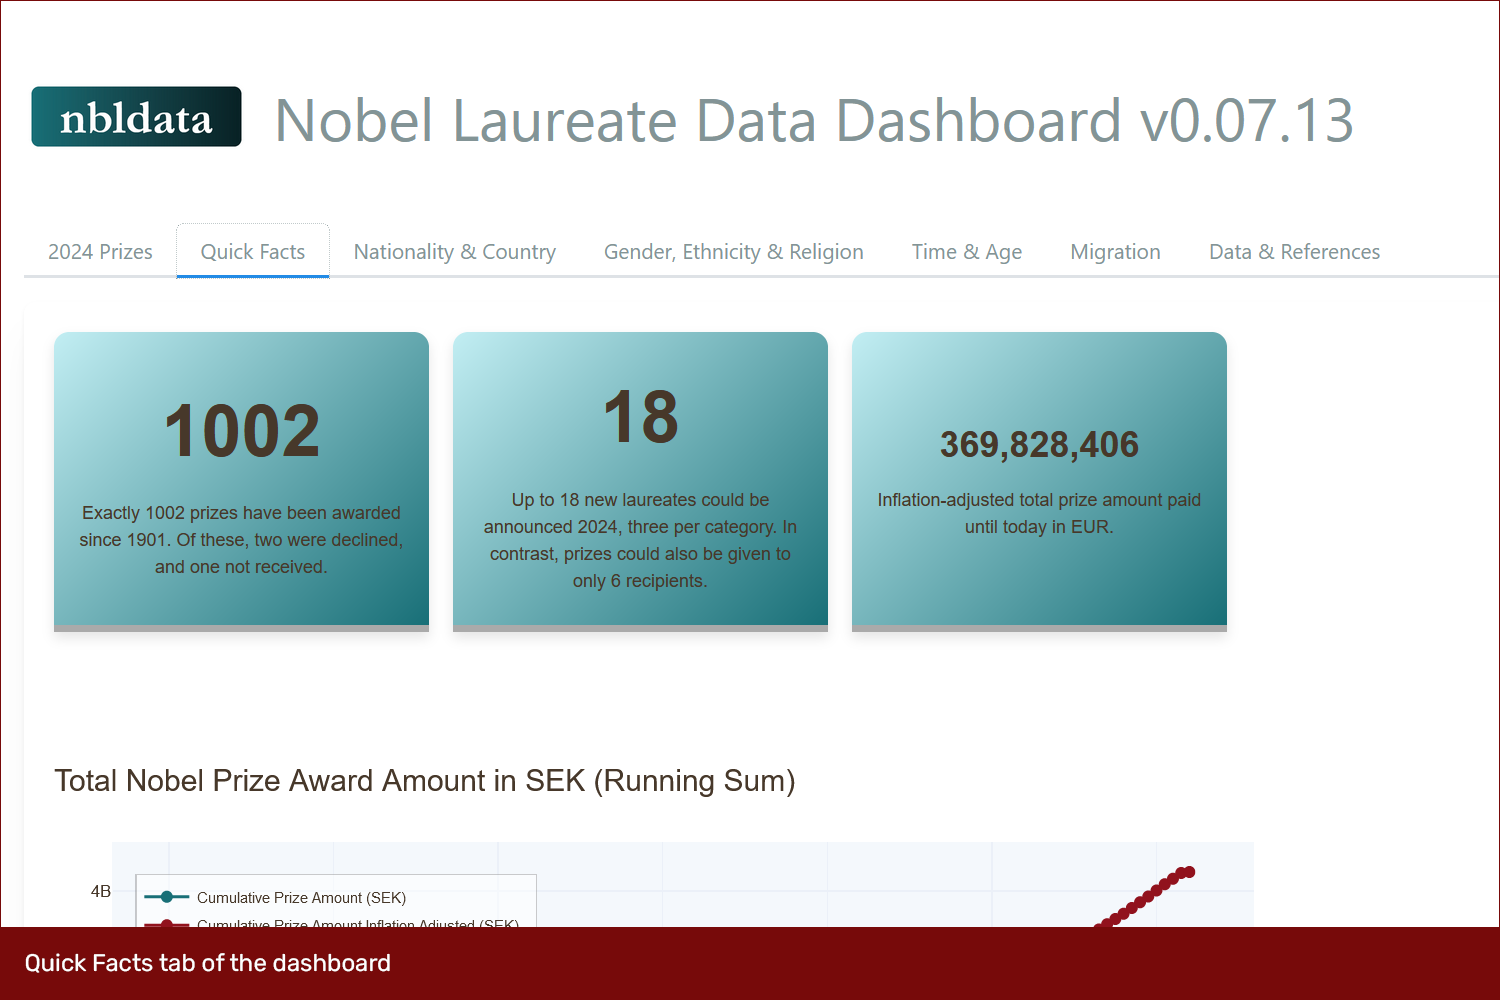
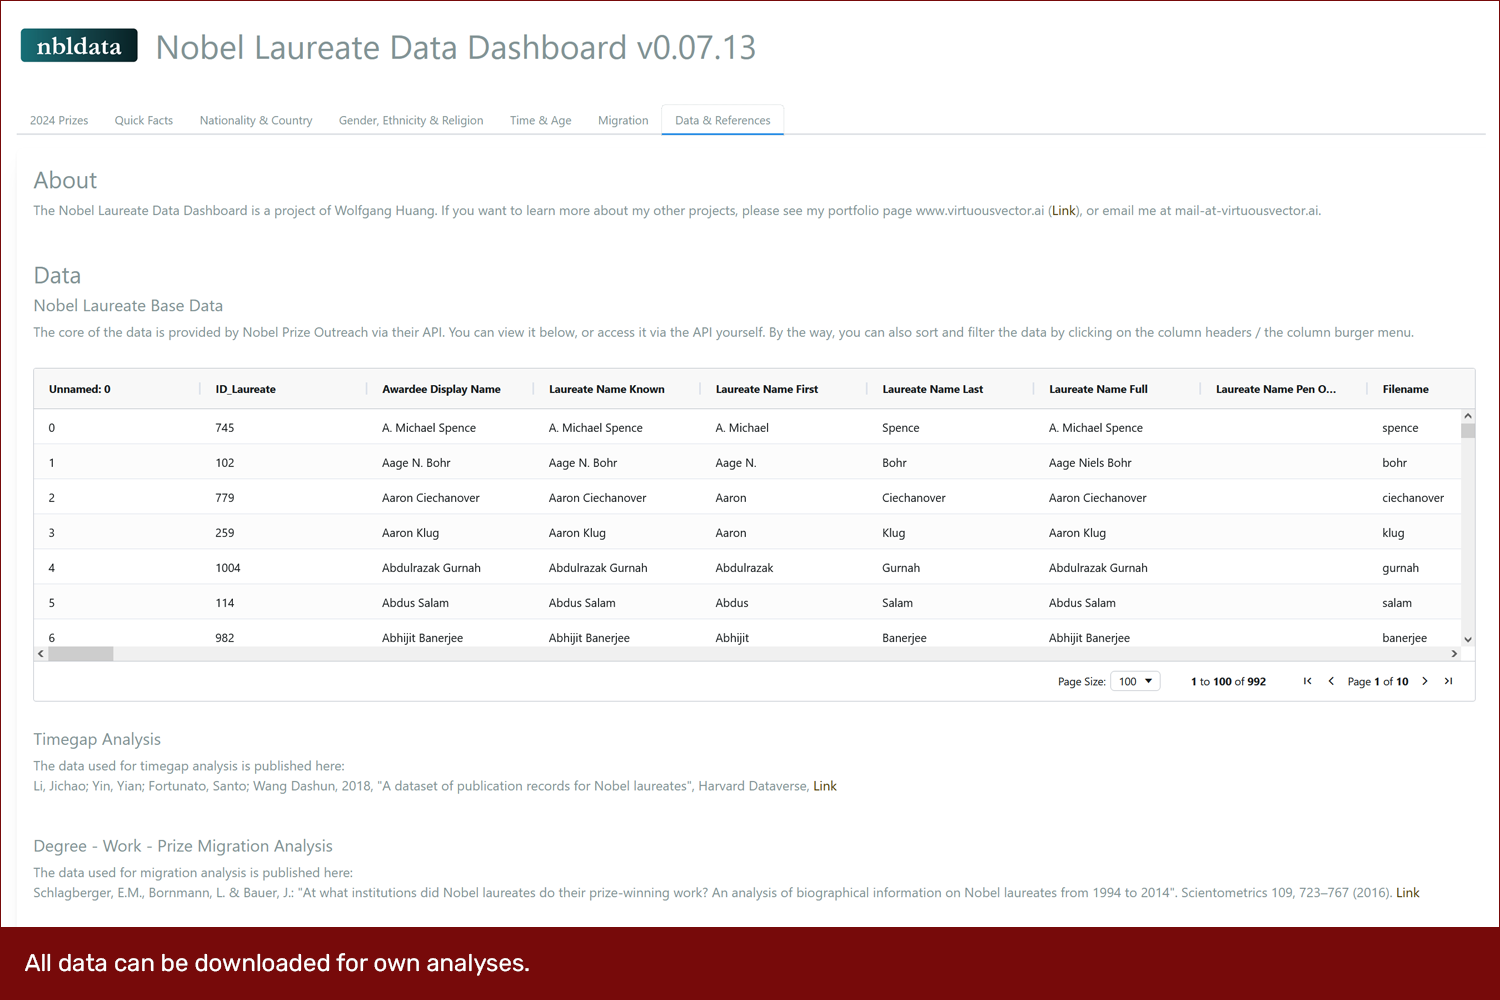
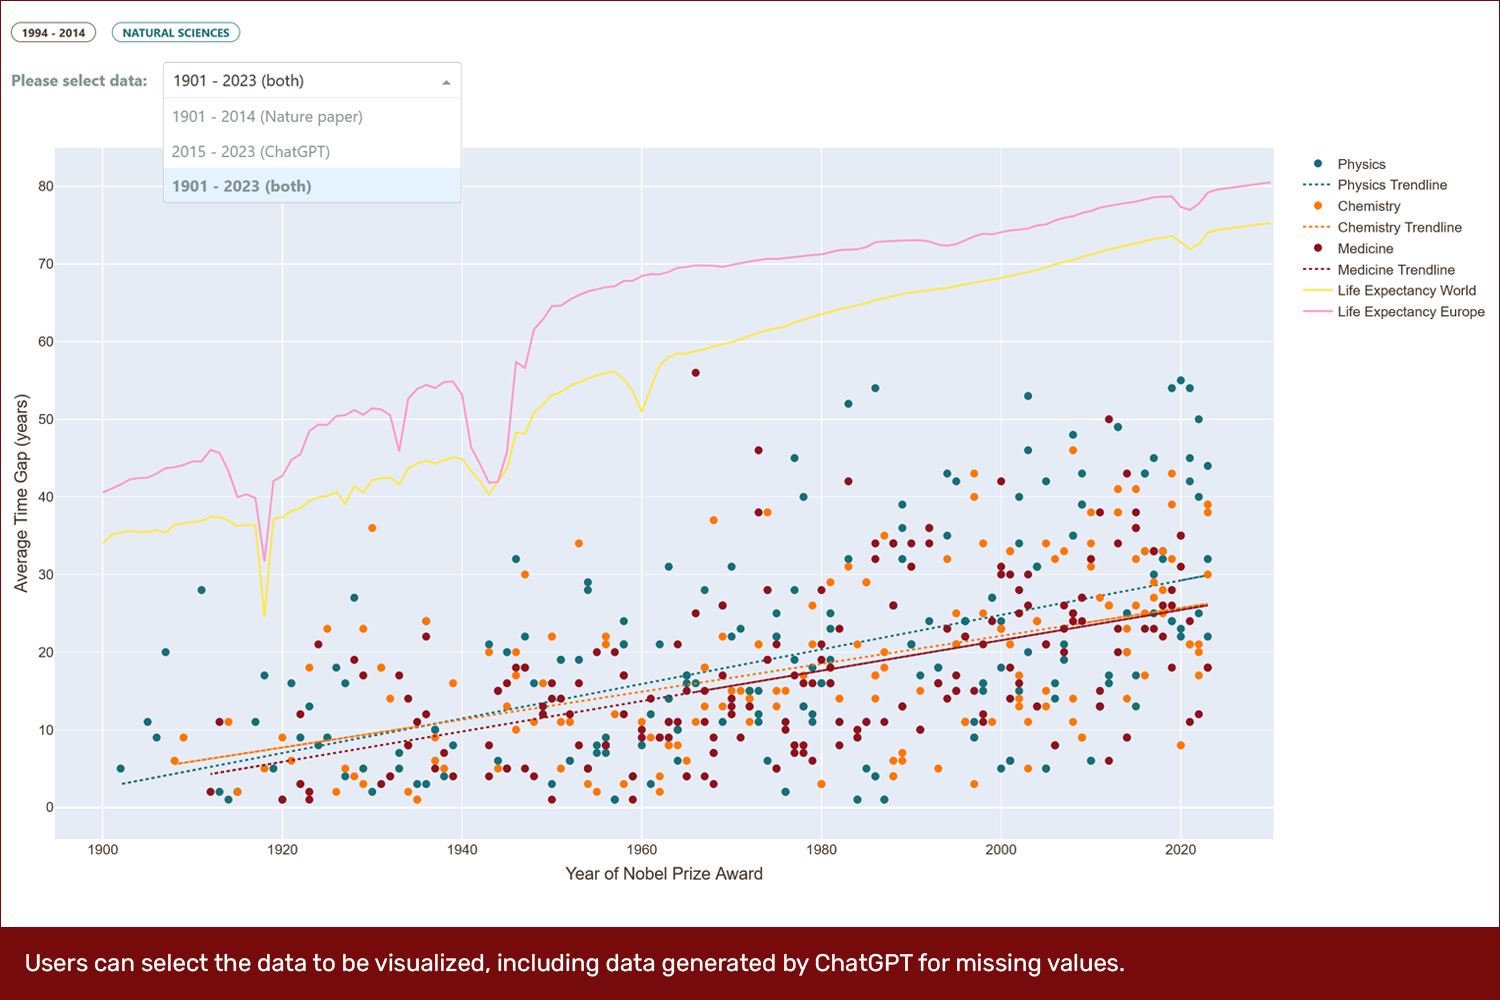
Most of the data is retrieved via the official API of nobelprize.org, but I have also added data I researched myself. As a test of GPT-o1, I also included the option to add data that ChatGPT researches in one of the visualizations.
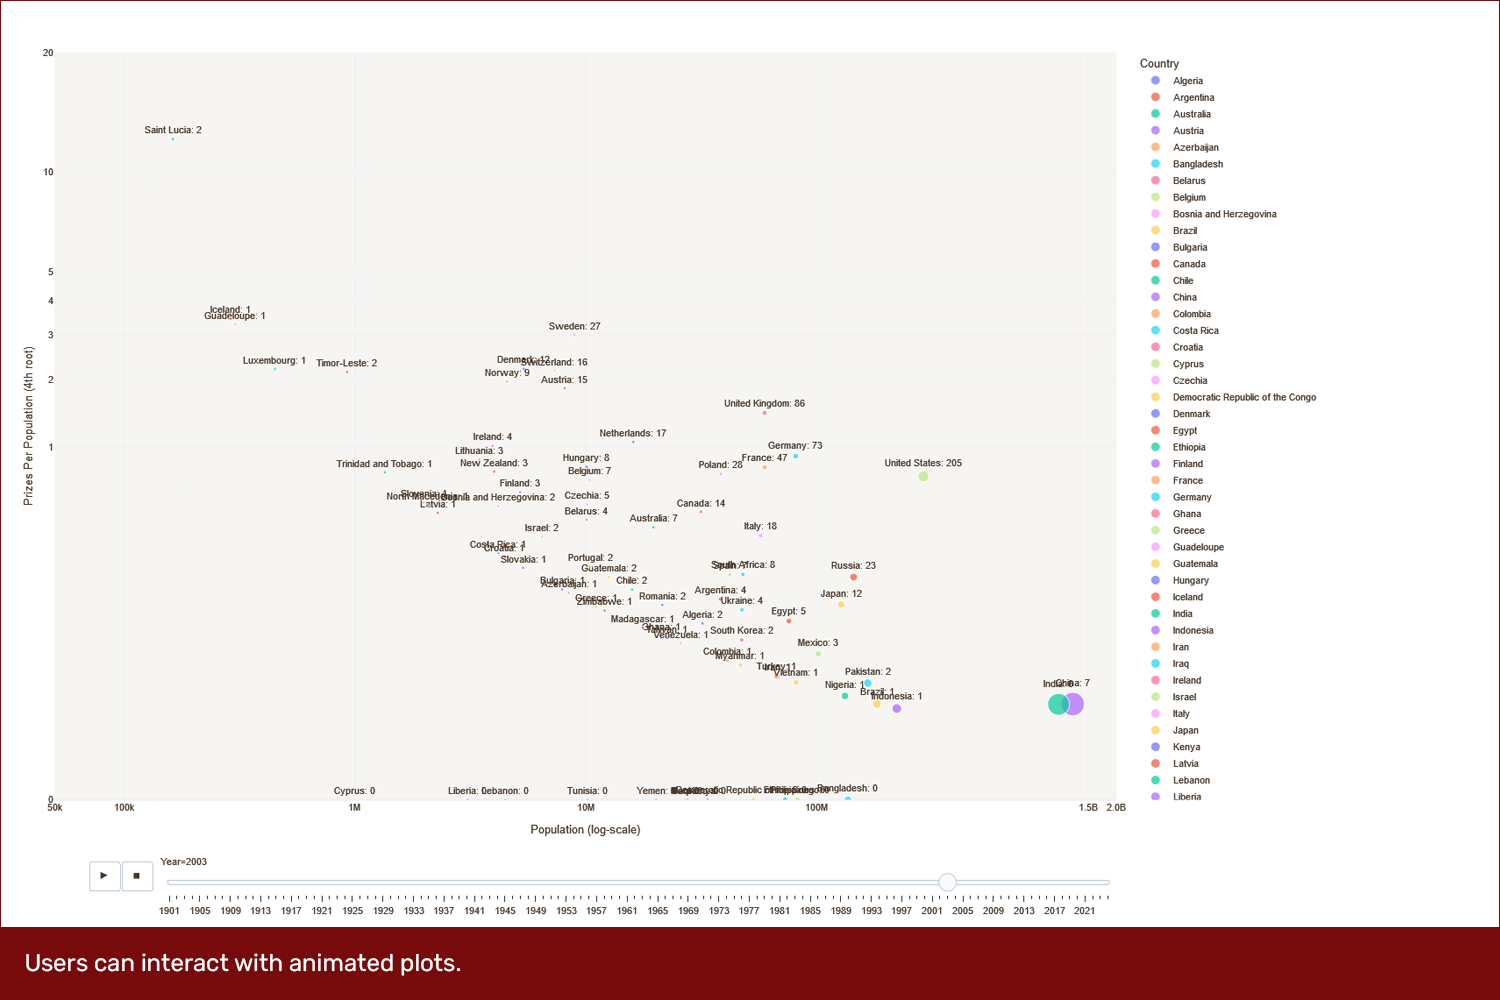
The best way to understand and explore this dashboard is to visit it.
Task
Develop and host an interactive, data-driven dashboard
-
Date
Oktober 1, 2024
-
Skills
Python, Plotly, Dash, Linux
-
Client
Portfolio